How to do that in Python?
A collection of code snippets to make my (and yours too!) python life a little easier. Click on the task in the list below to jump to that section.
- Automatically import packages in ipython
- Modify the default matplotlib style using stylesheet
- Create color cycler from colormap
- Plotting inside a colorbar
Automatically import packages in ipython
In theory, you can run any number of python scripts every time you startup an ipython instance. This is most useful to automatically import commonly used packages such as numpy and matplotlib. I also use it to set a custom matplotlib style while using ipython. Let's say we wish to run myscript.py (an example below) every time we start ipython.
import numpy as np
import matplotlib.pyplot as plt
plt.style.use('my_matplotlib.mplstyle')
plt.ion()
We simply copy this script to the location ~/.ipython/profile_default/startup/myscript.py and voila!
Modify the default matplotlib style using stylesheet
The default matplotlib style is an embarrassingly ugly plotting style and using it is a sure-fire way to let everyone know that you are a matplotlib noob. While there are numerous packages to make it look prettier (my favorite being seaborn), you can very easily create your own style! matplotlib provides an amazing level of plot customizability from tick sizes to frame color and from point markers to legend styles.
The first step is to create a file my_matplotlib.mplstyle using the list of customizable keywords found here (you don't have to use them all!). Following is my default matplotlib style, inspired by Peter Boorman.
#frame width
axes.linewidth: 2

#ticks in or out
xtick.direction: in
ytick.direction: in

#top and right ticks
xtick.top: True
ytick.right: True

#major ticks
xtick.major.size: 6
xtick.major.width: 2
ytick.major.size: 6
ytick.major.width: 2

#minor ticks
xtick.minor.size: 4
xtick.minor.width: 1.5
ytick.minor.size: 4
ytick.minor.width: 1.5

#tick size
xtick.labelsize: large
ytick.labelsize: large

#axes label
axes.labelsize: x-large
axes.labelweight: heavy

#title
axes.titlesize: xx-large
axes.titleweight: heavy

#legend
legend.fontsize: large
legend.title_fontsize: x-large

#lines
lines.linewidth: 2

#colors
axes.prop_cycle: cycler('color', ['66c2a5', 'fc8d62', '8da0cb', 'e78ac3', 'a6d854', 'ffd92f', 'e5c494', 'b3b3b3']) #currently using default 'Set2' from plt.cm.Set2.colors
You are now ready to use this style by simply adding the line plt.style.use('my_matplotlib.mplstyle') in your python programs. Alternatively, you can set this to be a default style in ipython using startup scripts.
Create color cycler from a colormap
Sometimes you need all the curves in your plot to have different shades of the same color, or maybe you need them to follow the colors from a colormap instead of the default blue, orange, green, ... order. You can do so using "color cycler". A "color cycler" is an object that matplotlib uses to assign a color to a new plot element.
plt.rcParams["axes.prop_cycle"] = plt.cycler("color", plt.cm.plasma(np.linspace(0, 1, 10)))Here's the breakdown of the above code: plt.cycler is a function that creates a cycler object for property color using the list of 10 colors sampled from the plasma colormap using plt.cm.plasma(np.linspace(0, 1, 10)). You can also create complicated cycler objects using a combination of color and linestyles as described here.
Plotting inside a colorbar
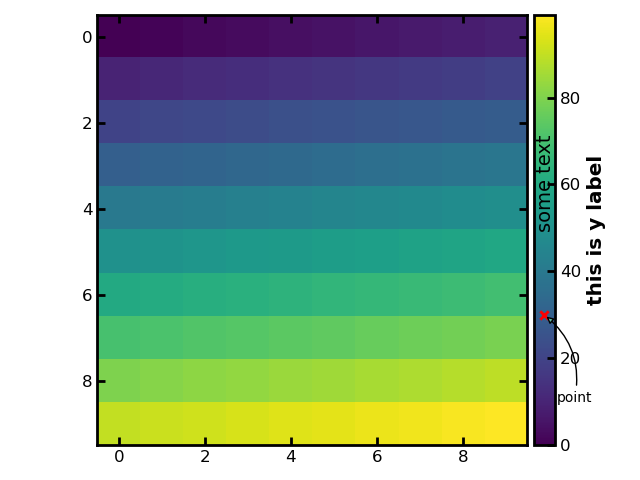
The colorbar object in python has it's own "AxesSubplot" instance that can be accessed using cb.ax where cb is a colorbar object created using plt.colorbar(). In other words, you can do everything with colorbars that you can do with subplots. For example, the following code will produce the image given below.
cb.ax.set_ylabel('this is y label') #add axes labels
cb.ax.scatter(0.5, 30, marker='x', color='r') #X-axis limits: 0 to 1; Y-axis limits: inferred from the figure
cb.ax.text(0.1, 50, "some text", rotation=90, fontsize=14) #add text
cb.ax.annotate("point", (0.5, 30), (1.1, 10), arrowprops={'arrowstyle': '-|>', 'connectionstyle': 'arc3,rad=0.3'}) #add annotations